Time-series forecasting: Bike Accidents
Time-series forecasting: Bike Accidents
About a year ago I posted this video visualization of all the reported accidents involving bicycles in Montreal between 2006 and 2010. In the process I also calculated and plotted the accident rate using a monthly moving average. The results followed a pattern that was for the most part to be expected. The rate shoots up in the spring, and declines to only a handful during the winter months.
It’s now 2013 and unfortunately our data ends in 2010. However, the pattern does seem to be quite regular (that is, exhibits annual periodicity) so I decided to have a go at forecasting the time series for the missing years. I used a seasonal decomposition of time series by LOESS to accomplish this.
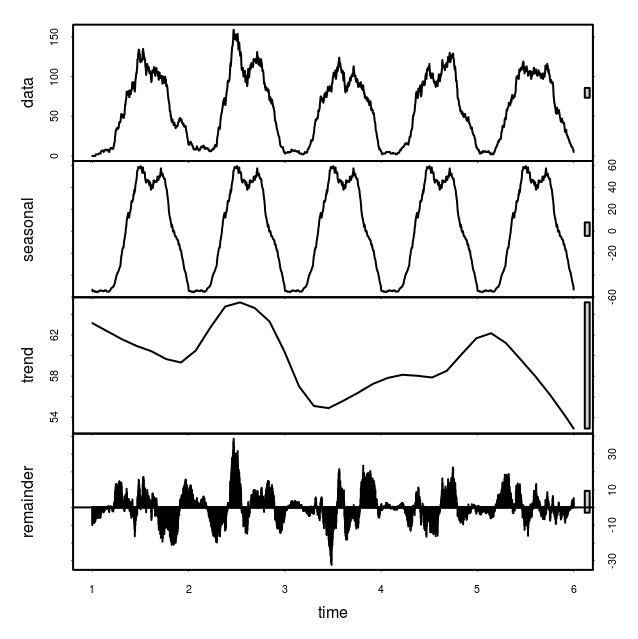
You can see the code on github but here are the results. First, I looked at the four components of the decomposition:
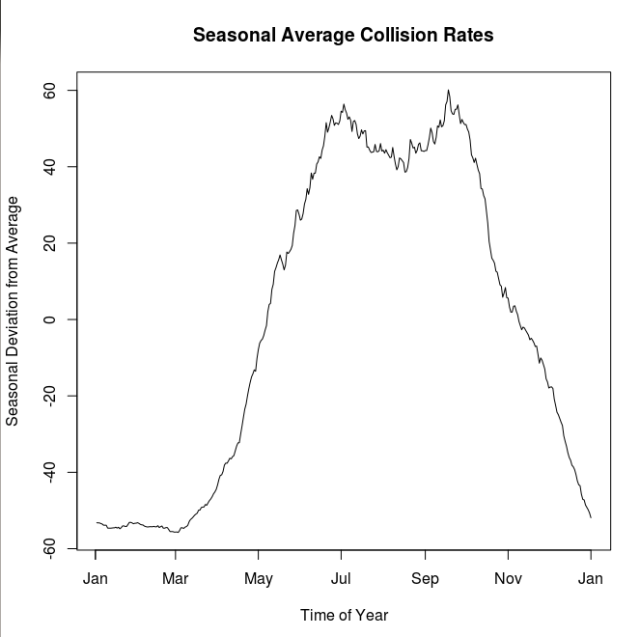
Indeed the seasonal component is quite regular and does contain the intriguing dip in the middle of the summer that I mentioned in the first post.
This figure shows just the seasonal deviation from the average rates. The peaks seem to be early July and again in late September. Before doing any seasonal aggregation I thought that the mid-summer dip may correspond with the mid-August construction holiday, however it looks now like it is a broader summer-long reprieve. It could be a population wide vacation effect.
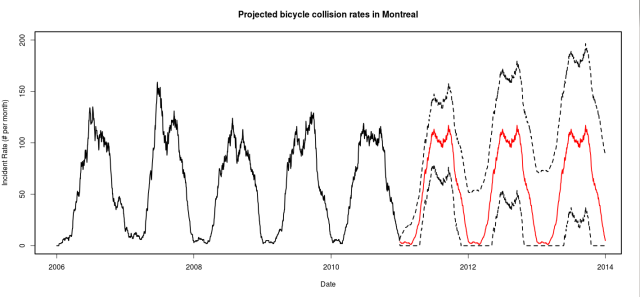
Finally, I used an exponential smoothing model to project the accident rates into the 2011-2013 seasons.
It would be great to get the data from these years to validate the forecast, but for now lets just hope that we’re not pushing up against those upper confidence bounds.


